For more information, please call: +44 (0) 1993 880 944
gi Perspective provides independent GIS consultancy services for environmental & natural resource organisations. Our team of experienced consultants deliver quality geographic information and digital mapping solutions with unmatched expertise.
We support a wide range of sectors, including marine and coastal environments, biodiversity mapping, and land use analysis, helping clients turn complex spatial data into clear, actionable insight.
Geographic Information Systems have become crucial tools for businesses. By helping organisations visualise data, conduct spatial analysis, and make decisions, GIS plays a key role in driving success.
While it may seem appealing to develop an in-house GIS team for complete control, partnering with a trusted GIS provider often brings more benefits, especially when considering cost, expertise, scalability, and risk reduction.
Can I take this opportunity to thank you and your team for an excellent service and contribution to our soils project. your patience and co-operation have been greatly appreciated and I hope there will be occasions to work together in the future.“
Christine Brown MSc
Forestry Commission
We are very happy with how the online map turned out and it has been a pleasure working with you. Thank you for all your great work with this.“
Orsolya Keri
Midlothian Council
As an independent GIS company we provide digital mapping solutions and consultancy services to a wide range of industries. We help organisations to better understand and gain benefit from the geographic information at their disposal. Our in-house team are highly experienced and knowledgeable, and we are proud of our flexible and professional approach.
gi Perspective are proud to be part of the Lovell Johns company: a leading mapping company with over 50 years' experience.
Working with you to understand project scope and existing property data, we will source and collate appropriate GIS datasets and build databases to securely store that data.
Our in-house team of specialists will analyse the data, identify patterns and report on key metrics, providing you with strategic insights and recommendations.
Ranging from individual licences through to enterprise level solutions, our industry-leading software helps your organisation to more easily benefit from from geographic data.
Your information will only be used to further your enquiry and is protected by our Privacy Policy.
Find out more how a GIS partner can benefit your organisation
Following a competitive tender process, gi Perspective were commissioned by Natural Resource Wales, the Welsh Government body responsible for environment and natural resources, to undertake a wildfire risk analysis and GIS layer development.
Our remit was to use GIS datasets, including data on historical wildfires, to create a wildfire risk index for a region of South Wales. We worked in collaboration with the ‘Healthy Hillsides’ project team, whose work aims to minimise the impact and severity of the frequent wildfires in the South Wales Valleys through better natural resource management.
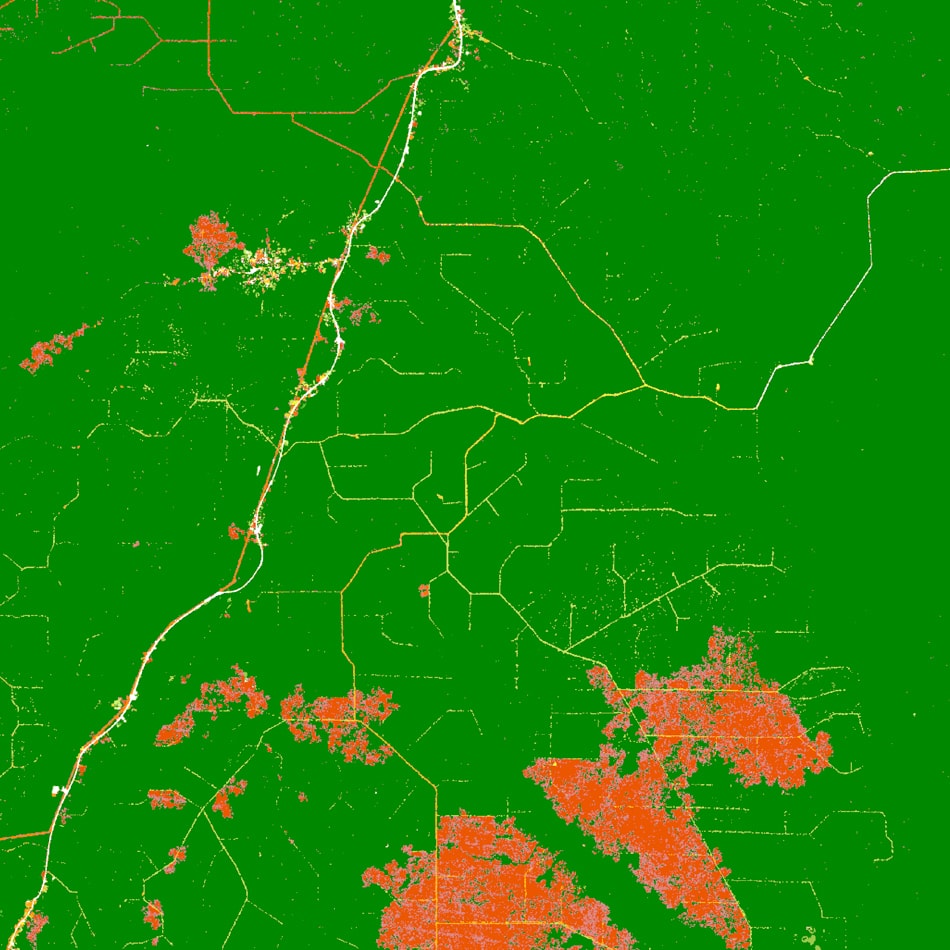
Our detailed plan set out the key project stages, from Engagement and Data Discovery, through Model Conceptualisation and Design, to the Risk Analysis and Refinement. Key risk elements were identified and weighted through a combination of expert stakeholder input, literature review and statistical analysis. A risk map is only as strong as the data inputs, so considerable time was spent reviewing and improving key datasets, notably the vegetation habitats data which describes the potential fuels for wildfires. Meanwhile, a sophisticated model was developed, using raster analysis in QGIS to quantify the risk of Ignitions, wildfire Spread and Impacts for each 25m x 25m cell across the study area. Initial risk scores were reviewed by the project team and other local stakeholders, and the model was revised to ensure that it was capturing the situations of greatest concern for local firefighters.
The assessment identified the 3 key risk factor datasets as historical wildfire ignitions, land cover habitat type and buildings. Lower weightings were given to many other layers including deprivation, slope, countryside access layers and exposed infrastructure. Wildfire risk was quantified across the study area and mapped as raster and vector layers, with PDF maps for stakeholders also highlighting the highest risk areas where interventions would be most valuable. The method used proved an efficient tool for approximating wildfire risk for those without recourse to specialist wildfire modelling software which can model the dynamic spread of fire across the landscape under particular weather conditions. Initial feedback for a few key fire station areas has confirmed that the risk map matches with local expectations and insight about areas of greatest risk.